0%

Elastic Stack(ELK)从入门到放弃

logo

一、ELK 入门

ELK 是什么?

ELK 是由三个软件名字的第一个字母组合成的缩写,这三个软件分别名为 ElasticsearchLogstashKibana

Logstash

  • Logstash 是数据的抽取、转换、装入工具,是一个 ETL 工具。
  • ETL: Extract-Transform-Load 的缩写,用来描述将数据从来源端经过抽取(extract)、转换(transform)、加载(load)至目的端的过程。

Elasticsearch

  • Elasticsearch 是一个搜索引擎,能够把 Logstash 发来的数据在本地完成切词、分析、存储,并支持检索。

Kibana

  • Kibana 提供一个利用 Elasticsearch 的 RESTful 接口来完成数据检索展示的非常直观的用户界面,是一个可视化工具。

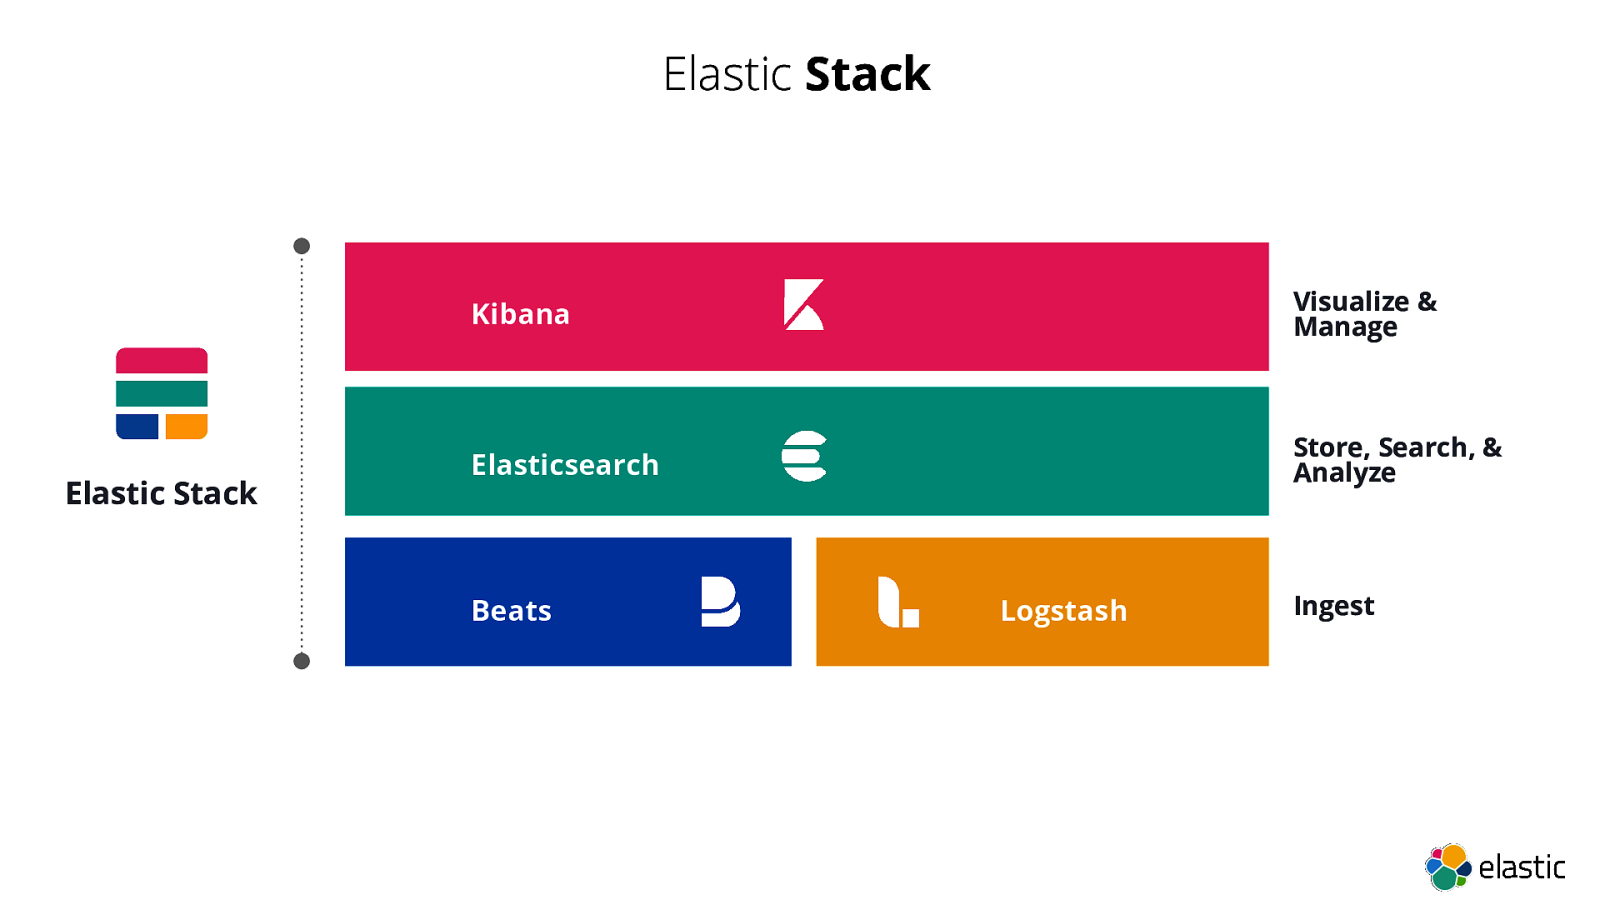
最初的时候,这样一个整体就被称为 ELK,但是对于日志采集来说,Logstash 太过于重量级了,所以后来就有了一个轻量化的采集工具 Filebeat 用于代替 Logstash 完成日志采集的工作。但是 Logstash 也不是就不使用了,而是作为其他用途继续使用,所以严格来说这个集群应该称为 ELFK,不过后来为了简便都被称为 Elastic stack,是一个工具栈。

Elastic stack 的架构

Filebeat 用来做什么?

假设当前有一组 tomcat 服务器,那么 Filebeat 就部署在 tomcat 服务器上,任务是采集日志。之前这个工作是由 Logstash 来完成,当时因为太重量级,所以现在都使用比较轻量的 Filebeat 来完成日志采集工作。

采集日志由 Filebeat 完成,那么 Logstash 存在的意义是什么?

如果 Filebeat 把收集到的日志全部都发给 Elasticsearch,那么 Elasticsearch 要面对的 Filebeat 节点就太多了;而且 Elasticsearch 所接收的数据,是需要经过文档化处理后的数据,但是 Filebeat 并不擅长把数据文档化,当时这是 Logstash 的强项,所以会有一台独立的 Logstash 专门用来接收 Filebeat 发来的数据。

ELFK 的工作流程

Filebeat 把收集的日志发给 Logstash,然后由 Logstash 在本地做格式转换,包括数据文档化、无效数据清理、时间日期格式转换等,再统一发送到 Elasticsearch 集群。然后 Kibana 通过 http 协议连入 Elasticsearch 集群读取数据,并按照事先定义好样式将数据展示为图形;

info

Kibana 对接 Elasticsearch 的方案

Elasticsearch 是一个集群,不只有一台主机,但是 Kibana 只能连接至一个节点上,这会妨碍集群的使用。不过好在 Elasticsearch 是无状态的,可以在前端加一个负载均衡器,将 Kibana 的请求负载均衡到各个 Elasticsearch 节点。

关于 Elasticsearch 的一些概念

Elasticsearch 内部保存的数据使用倒排索引;
而且一定要使用 Hosts 来解析其他节点的地址,不能只依靠外部 DNS,防止外部 DNS 故障时集群内部无法通信。

二、安装 Elastic stack 的准备工作

注意

Elasticsearch 是分布式集群,和大多数分布式集群一样遵循 Paxos 协议,所以主机的数量建议为奇数个,相互之间一定要保证时间同步;

Elastic stack 没有被收录在自带的源中,需要去下载官方的 YUM 配置文件或 RPM 安装包。

以下网页中提供了包括 RPM、YUM、DEB 等常见的安装方式的下载:

  • 当前最新版是 7.3.2 版,等你打开的时候可能已经更新到更高的版本了;生产环境中不建议使用太新的版本。

Elastic stack 都是 Java 程序,需要运行在 JVM 虚拟机中,所以在运行程序前需要手动安装好 Java。

1
yum install java-11-openjdk

三、Elasticsearch 的安装和使用

安装 Elasticsearch 程序

Elasticsearch 至少需要安装在 3 个节点中,总体个数要为奇数。

1
yum install elasticsearch-7.3.2-x86_64.rpm

配置 Elasticsearch

安装后生成的配置文件有:

  • 主配置文件为:/etc/elasticsearch/elasticsearch.yml
  • JVM 参数配置文件:/etc/elasticsearch/jvm.options
  • JAVA 日志格式配置文件:/etc/elasticsearch/jog4j2.properties
  • 配置脚本:/etc/elasticsearch/scripts

1. 一些基础的配置

vim /etc/elasticsearch/elasticsearch.yml

  • cluster.name: my-application:定义集群名称,用于多个节点间互相识别使用。建议集群名字和使用目的相吻合;
  • node.name: node-1:当前节点的名称;建议使用当前能解析的主机名;
  • node.attr.rack: r1:定义机柜位置;
  • path.data: /var/lib/elasticsearch:定义数据文件存放位置;
  • path.logs: /var/log/elasticsearch:定义日志文件存放位置;
  • network.host: 192.168.50.11:定义本机监听地址;
  • http.port: 9200::定义监听端口;
  • discovery.zen.ping.unicast.hosts: ["host1","host2"]:使用单播的方式做集群关系判定;
    • 解释:使用 zen 协议,通过 ping 利用单播 unicast 的形式来判断主机在线与否;[] 中定义主机列表,可以使用主机名和 IP 地址;在新版本中这个配置叫 discovery.seed_hosts
  • discovery.zen.minimum_master_nodes: 3:最少有几个主节点;7.0 之后已废弃此配置项
  • cluster.initial_master_nodes: ["node-1", "node-2"]7.0 之后新增的配置;如果普通用,此配置不设的话,集群会默认把第一个启动的当 master,其他节点也会去局域网里搜+选主,但是这样比较危险(可能脑裂或者卡在仲裁投票的状态时间太长之类的),所以建议在生产环境把有选主资格的节点放里面,这样就不会浪费那么多时间、资源了。

2. 配置 JVM 参数

编辑 /etc/elasticsearch/jvm.options

  • -Xms2g:初始化堆内存空间大小;
  • -Xmx2g:堆内存最大空间大小;

注意:Elasticsearch 中要求以上两个参数数值一样;

3. 同步配置

将上面编辑的配置文件同步至其他节点,并修改独有信息,比如 IP、节点名称等。

4. 创建数据目录

Elasticsearch 的 JVM 程序是由 elasticsearch 用户运行的,所以数据目录一定要有访问权限。

7.0 之后的版本应该不再用此步骤,不过还是建议启动服务前检查一下目录权限。

1
2
mkdir -p /var/lib/elasticsearch && chown elasticsearch:elasticsearch /var/lib/elasticsearch
mkdir -p /var/log/elasticsearch && chown elasticsearch:elasticsearch /var/log/elasticsearch

5. 启动服务

在所有节点启动 elasticsearch 守护进程服务。

1
-> # systemctl start elasticsearch

因为是 Java 程序,所以启动会有点慢,稍等片刻就可以看到两个端口都开始监听。

  • 9200:为客户端提供业务的端口;客户端可以通过此接口存数据,也可以用来搜索操作;
  • 9300:集群内部协调端口;比如判断谁是 leader,当前集群状态是什么等;
1
2
3
4
-> # ss -tnl
State Recv-Q Send-Q Local Address:Port Peer Address:Port
LISTEN 0 128 192.168.50.11:9200 *:*
LISTEN 0 128 192.168.50.11:9300 *:*

6. 验证服务

程序启动后向任何一个节点的 9200 端口发起请求,会返回如下的首页页面,说明程序正常运行。

1
2
3
4
5
6
7
8
9
10
11
12
13
14
15
16
17
18
~]# curl http://node1.monster.com:9200/
{
"name" : "node1.monster.com",
"cluster_name" : "my-monster",
"cluster_uuid" : "YBdPX64KTSSPfHUTQg4pQA",
"version" : {
"number" : "7.3.2",
"build_flavor" : "default",
"build_type" : "rpm",
"build_hash" : "1c1faf1",
"build_date" : "2019-09-06T14:40:30.409026Z",
"build_snapshot" : false,
"lucene_version" : "8.1.0",
"minimum_wire_compatibility_version" : "6.8.0",
"minimum_index_compatibility_version" : "6.0.0-beta1"
},
"tagline" : "You Know, for Search"
}

常见故障解决

如果返回的首页中 "cluster_uuid" 的值为 _na_,则在主配置文件中启用此参数即可 cluster.initial_master_nodes

Elasticsearch 中的基础概念

一般情况下 ElasticSearch 中的概念都可以和 SQL 关系型数据库进行对应,对应起来也非常方便理解,简单的对应关系如下:

Elasticsearch SQL Database
Index Database
Type Table
Document Row
Field Column

注意Type 将在 Elasticsearch 7.0.0 中的 API 中弃用,并在 8.0.0 中完全删除。

API 的使用

Elasticsearch 提供了 RESTful 风格的 API 接口,可直接接在 URL 后使用,语法为:

1
`curl  -X<VERB> '<PROTOCOL>://<HOST>:<PORT>/<PATH>?<QUERY_STRING>' -d '<BODY>'`
  • <VERB>:指明请求的方法是哪个,包括 GETPOSTPUTDELETE
  • ?<QUERY_STRING>:查询请求;
  • <BODY>:json 格式的请求主体;
  • <PATH>:访问一个文档时的路径格式:/index_name/type/Document_ID/
    • index_name:索引名称;
    • type:类型名称;
    • Document_ID:文档 ID;

示例:请求文档

使用 GET 请求一个文档 my_cluster/id/1,文档不存在也没关系,只是会返回未找到。

1
2
-> # curl -XGET 'http://192.168.50.11:9200/my_cluster/id/1' 
{"error":{"root_cause":[{"type":"index_not_found_exception","reason":"no such index [my_cluster]","resource.type":"index_expression","resource.id":"my_cluster","index_uuid":"_na_","index":"my_cluster"}],"type":"index_not_found_exception","reason":"no such index [my_cluster]","resource.type":"index_expression","resource.id":"my_cluster","index_uuid":"_na_","index":"my_cluster"},"status":404}#

返回的是 json 格式的数据,不易查看,可在最后加上 ?pretty=true 以美观格式输出。

1
2
3
4
5
6
7
8
9
10
11
12
13
14
15
16
17
18
19
20
21
22
-> # curl -XGET 'http://192.168.50.11:9200/my_cluster/id/1?pretty=true'
{
"error" : {
"root_cause" : [
{
"type" : "index_not_found_exception",
"reason" : "no such index [my_cluster]",
"resource.type" : "index_expression",
"resource.id" : "my_cluster",
"index_uuid" : "_na_",
"index" : "my_cluster"
}
],
"type" : "index_not_found_exception",
"reason" : "no such index [my_cluster]",
"resource.type" : "index_expression",
"resource.id" : "my_cluster",
"index_uuid" : "_na_",
"index" : "my_cluster"
},
"status" : 404
}

或者使用 jq 程序也可以美化输出,epel 源已收录 jq。

1
2
3
4
5
6
7
8
9
10
11
12
13
14
15
16
17
18
19
20
21
22
23
~]# yum install jq
~]# curl -s -XGET 'http://192.168.50.11:9200/my_cluster/id/1' | jq
{
"error": {
"root_cause": [
{
"type": "index_not_found_exception",
"reason": "no such index [my_cluster]",
"resource.type": "index_expression",
"resource.id": "my_cluster",
"index_uuid": "_na_",
"index": "my_cluster"
}
],
"type": "index_not_found_exception",
"reason": "no such index [my_cluster]",
"resource.type": "index_expression",
"resource.id": "my_cluster",
"index_uuid": "_na_",
"index": "my_cluster"
},
"status": 404
}

示例:创建文档

创建一个文档,指定名称为 2,并指定在哪个索引及类型下创建;索引和类型不存在也没关系,会自动创建,并使用 -d 指明文件内容,内容需要使用 JSON 格式 {"key1": "value1", "key2": value, ...}

6.0 之前语法

1
curl -XPUT http://192.168.50.11:9200/my_cluster/id/2 -d '{"name":"BiKaQiu","age":"6","ShuXing":"Flash"}'

6.0 之后语法,需要使用 -H "Content-Type: application/json" 来指明文档主体类型,官方说明。

1
curl -H "Content-Type: application/json" -XPUT http://192.168.50.11:9200/my_cluster/id/2 -d '{"name":"BiKaQiu","age":"6","ShuXing":"Flash"}'

查询刚才创建的文档:

1
2
3
4
5
6
7
8
9
10
11
12
13
14
15
-> # curl -XGET http://192.168.50.11:9200/my_cluster/id/2\?pretty
{
"_index" : "my_cluster",
"_type" : "id",
"_id" : "2",
"_version" : 1,
"_seq_no" : 0,
"_primary_term" : 1,
"found" : true,
"_source" : {
"name" : "BiKaQiu",
"age" : "6",
"ShuXing" : "Flash"
}
}

示例:搜索指定的关键字

简单字符串的搜索语法:

1
`curl -X GET '<SCHEME://<HOST>:<PORT>/[INDEX/TYPE/]_search?q=KEYWORD&sort=DOMAIN:[asc|desc]&from=#&size=#&_source=DOMAIN_LIST`。
  • ../_search:搜索所有的索引和类型;
  • ../INDEX_NAME/_search:在指定的单个索引中搜索;
  • ../INDEX1,INDEX2/_search:在指定的多个索引中搜索;
  • ../s*/_search:搜索所有以 s 开头的索引;
  • ../INDEX_NAME/TYPE_NAME/_search:在指定的单个索引中搜索指定的类型;
1
2
3
4
5
6
7
8
9
10
11
12
13
14
15
16
17
18
19
20
21
22
23
24
25
26
27
28
29
30
31
-> # curl -s http://node1.monster.com:9200/_search?q=ShuXing:Flash | jq
{
"took": 6,
"timed_out": false,
"_shards": {
"total": 1,
"successful": 1,
"skipped": 0,
"failed": 0
},
"hits": {
"total": {
"value": 1,
"relation": "eq"
},
"max_score": 0.2876821,
"hits": [
{
"_index": "my_cluster",
"_type": "id",
"_id": "2",
"_score": 0.2876821,
"_source": {
"name": "BiKaQiu",
"age": "6",
"ShuXing": "Flash"
}
}
]
}
}

其他 API 接口

API 中还有一些特殊的接口:/_cat/_search/_cluster,比如 /_cat 可以查看 Elasticsearch 集群的一些相关信息,直接回车会列出可用的选项。

1
2
3
4
5
6
7
8
9
10
-> # curl http://node1.monster.com:9200/_cat     
=^.^=
/_cat/master # 查看当前主节点是哪个
/_cat/nodes # 查看当前有多少个主机
/_cat/indices # 查看当前有多少索引
/_cat/health # 查看集群健康状态,有三种 green、yellow、red
/_cat/thread_pool # 查看当前有多少线程池
/_cat/thread_pool/{thread_pools}
/_cat/plugins # 查看安装的插件
/_cat/templates # 查看模板

四、Logstash 的安装和使用

什么是 Logstash?

Logstash 和 Filebeat 的关系

Elasticsearch 用于信息检索,但是信息的数据是通过 Logstash 来收集的。不过 Logstash 过于重量级,所以在单机内获取数据时,则使用 Beats 当中的组件 Filebeat 来代替 Logstash 收集日志的工作。而 Logstash 的用途则变成将 Beats 发来的数据文档化后发往 Elasticsearch。

插件化

Logstash 是高度插件化的,通过插件可以从各种不同的源采集数据,然后过滤器插件进行数据转换,最后把处理好的数据发给众多输出插件中的一个

Logstash 可以通过插件实现两种工作模式:

  • agent:在目标服务器上收集信息,发给 server;
  • server:从各个 agent 上接收数据并转换;

Beats 套件

之前说过 Logstash 作为 agent 太重量级了,所以官方开发了专门用来作为 agent 端的程序,名为 Beats Family,是一组套件,包含:

  • Filebeat:专门从文件中抽取数据;
  • Metricbeat:专门收集指标数据;
  • Packetbeat:专门对网络通信流量进行抓包分析;
  • Winlogbeat:在 Windows 中专门收集 Event 日志;
  • Auditbeat:收集审计日志;
  • Heatbeat:探测服务器健康状态;

这里先讲解 Logstash 是如何使用的,后面会介绍 Filebeat。

安装 Logstash 程序

这里使用 Logstash 在一台主机上同时部署 agent 端、server 端;并安装 httpd 用来产生大量日志。

安装 Logstash 和 httpd,其中 Logstash 的 RPM 包已经提前下载好并上传至服务器。

Logstash 也是 JAVA 程序,要同时安装好依赖的运行环境 OpenJDK。

1
yum install ./logstash-7.3.2.rpm httpd java-11-openjdk

Logstash 的配置文件

  • 主配置文件:vim /etc/logstash/logstash.yml
  • 启动时传递的选项:/etc/logstash/startup.options;
  • 配置 JVM 参数:/etc/logstash/jvm.options
  • 配置 JAVA 日志格式:/etc/logstash/jog4j2.properties
  • 插件配置文件:/etc/logstash/conf.d/ 放在这个目录下的每一个配置文件都会被当做配置文件使用;在主配置文件中定义了插件配置文件的目录 path.config: /etc/logstash/conf.d

命令行工具

二进制主程序在 /usr/share/logstash/bin/logstsh,这无法被 PATH 变量获取,导致只能通过服务而无法在命令行使用,如需在命令行使用可添加一个 PATH 搜索路径:

1
2
3
4
> # vim /etc/profile.d/logstash.sh
export PATH=/usr/share/logstash/bin:$PATH

> # exec bash

在命令行可使用 logstash --help 可查看帮助信息,logstash 也是 Java 程序,运行非常缓慢,需要稍等一会。

  • -n:指定节点名;
  • -f:加载指定配置文件;
  • -t:语法测试,测试完退出而不执行;
  • -r:如果配置文件发生改变,可以自动 reload;

模拟多个客户端访问 httpd 生成大量日志

在后面的配置中,需要使用 httpd 的 Access 日志,为了让数据更真实一些,使用下面的方式生成多个客户端的访问日志。

  1. 在 httpd 的配置文件中,对 combined 格式的日志添加一个字段 %{X-Forwarded-For}i

  2. /var/www/html 下批量创建 20 个供用户访问的测试页。

1
-> # for i in {1..20}; do echo "test_page_$i" > test_page_$i.html; done 

使用 curl 作为客户端来访问测试页;访问时通过指定自定义首部 curl -H "X-Forwarded-For:X.X.X.X",来模拟出随机的 IP 并随机访问测试页,产生大量日志。

1
2
3
4
$ while true; \
do curl -H "X-Forwarded-For:$[$RANDOM%254+1].$[$RANDOM%255].1.1" \
http://192.168.50.14/test_page_$[$RANDOM%20+1].html; \
sleep 1; done

如何使用插件?

插件配置文件的使用格式:

1
2
3
4
5
input {}  /* 定义输入插件 */

filter {} /* 定义过滤器插件 */

output {} /* 定义输出插件 */

可以在官方文档中找到可以使用的插件列表。

常用的比如:

  • Input plugins:输入类型的插件,支持很多种,例如:
    • Stdin input plugin 插件:可以从标准输入获取数据的插件;插件有很多属性,如果不定义,则会使用默认值,比如:
      • add_field:额外添加一个字段;
      • codec:使用什么编码器;
      • tags:定义一个标签;
      • type:定义类型,而每个类型都有各自的格式要求;
  • Filter plugins:过滤器类型的插件分类;
  • Output plugins:输出类型的插件分类;
    • Stdout output plugin: 这个是从标准输出显示数据的插件;

stdin 和 stdout 插件配置

标准输入 -> 标准输出

使用 stdinstdout 插件,从标准输入获取数据,输出至标准输出。

/etc/logstash/conf.d 下创建一个插件的配置文件,名字可以自定义,例如 vim /etc/logstash/conf.d/stdin-output.conf

1
2
3
4
5
6
7
8
9
10
input {
stdin {} /* 定义输入插件使用 stdin */
}

output {
stdout { /* 定义输出插件使用 stdout */
codec => rubydebug /* 建议输出为 JSON 格式的文档,
因为 Elasticsearch 只支持 JSON 格式的文档 */
}
}

使用 logstash -f /etc/logstash/conf.d/stdin-output.conf -t 检测配置文件中是否有语法错误,如果返回结果中包含 Configuration OK 即可。

使用 logstash -f /etc/logstash/conf.d/stdin-output.conf 启动 Logstash,此时程序就会在标准输入等待用户输入数据,然后以 JSON 格式显示到标准输出。

1
2
3
4
5
6
7
8
9
10
11
12
-> # logstash -f /etc/logstash/conf.d/stdin-output.conf 

The stdin plugin is now waiting for input:

HELLO Logstash Page

{
"@version" => "1",
"message" => "HELLO Logstash Page ",
"@timestamp" => 2019-09-30T14:08:45.394Z,
"host" => "node4"
}

从文件输入 --> 标准输出

在上面的基础上,将获取数据的方式,从标准输出改为从 httpd 的 Access 日志中获取数据。

需要用到 File input plugin 插件,此插件支持的属性有:

  • path:定义从哪个文件读数据(必需);语法格式为列表,可以指定多个文件;
  • start_position:从指定文档的何处加载内容,"beginning" 表示从文件第一行开始读,"end" 表示从上一次读取结束的位置开始读。
  • max_open_files:定义能同时打开的文件数;

创建插件的配置文件,名字可以自定义。
vim /etc/logstash/conf.d/file-output.conf

1
2
3
4
5
6
7
8
9
10
11
12
13
input {
file {
path => ["/var/log/httpd/access_log"] /* 指定 httpd 访问日志的路径 */
start_position => "beginning" /* 从第一行开始读 */
}
}

output {
stdout { /* 定义输出插件使用 stdout */
codec => rubydebug /* 建议输出为 JSON 格式的文档,
因为 Elasticsearch 只支持 JSON 格式的文档 */
}
}

启动程序,就会滚动显示 httpd 访问日志中的数据了。

1
2
3
4
5
6
7
8
9
10
11
12
13
14
15
16
17
18
19
20
21
22
23
> # logstash -f /etc/logstash/conf.d/file-output.conf

{
"path" => "/var/log/httpd/access_log",
"message" => "163.33.1.1 - - [30/Sep/2019:17:02:52 +0800] \"GET /test_page_13.html HTTP/1.1\" 200 13 \"-\" \"curl/7.29.0\"",
"@version" => "1",
"@timestamp" => 2019-09-30T14:33:38.218Z,
"host" => "node4"
}
{
"path" => "/var/log/httpd/access_log",
"message" => "153.195.1.1 - - [30/Sep/2019:17:02:53 +0800] \"GET /test_page_2.html HTTP/1.1\" 200 12 \"-\" \"curl/7.29.0\"",
"@version" => "1",
"@timestamp" => 2019-09-30T14:33:38.218Z,
"host" => "node4"
}
{
"path" => "/var/log/httpd/access_log",
"message" => "219.50.1.1 - - [30/Sep/2019:17:02:54 +0800] \"GET /test_page_20.html HTTP/1.1\" 200 13 \"-\" \"curl/7.29.0\"",
"@version" => "1",
"@timestamp" => 2019-09-30T14:33:38.218Z,
"host" => "node4"
}

可以看出 message 中显示的就是 access_log 日志中整行的信息。但是 Elasticsearch 是无法理解每段的含义的,所以需要将数据分割并定义其含义,这就需要用到 Filter plugins 中的 Grok filter plugin 插件。

Grok filter plugin 模式匹配插件

模板

Grok 插件可以将任意文本结构化,方法是先自定义一个模式的匹配方法,然后被此模式匹配到的数据会被加一个 key。比如 %{IP:client} 就代表被名为 IP 的模式匹配到的数据就会被加一个 key 为 client

但是如果每个模式都需要自己写就太头疼了,因此 Logstash 中已经内键了许多常用的模式

在文件夹中 /usr/share/logstash/vendor/bundle/jruby/2.5.0/gems/logstash-patterns-core-4.1.2/patterns/grok-patterns

比如:

  • USERNAME
  • IPV6
  • IPV4
  • IP

通过将各种模式拼凑起来,就可以分析出 access_log 整行数据的含义。不过例如 httpd 这种常见的程序已经内键了组合好的模式,可直接使用,不用自己写了。

/usr/share/logstash/vendor/bundle/jruby/2.5.0/gems/logstash-patterns-core-4.1.2/patterns/httpd 内保存了内键的 httpd 模式组合。
比如:

  • HTTPD_COMMONLOG
  • HTTPD_COMBINEDLOG
  • HTTPD20_ERRORLOG
  • HTTPD24_ERRORLOG

Grok 插件支持的属性:

  • match:指定 output 中的哪个字段要做模式匹配并切割。

示例:分析 httpd 日志

将以下信息中 message 字段单独拿出来做切割并模式匹配。

1
2
3
4
5
6
7
{
"path" => "/var/log/httpd/access_log",
"message" => "219.50.1.1 - - [30/Sep/2019:17:02:54 +0800] \"GET /test_page_20.html HTTP/1.1\" 200 13 \"-\" \"curl/7.29.0\"",
"@version" => "1",
"@timestamp" => 2019-09-30T14:33:38.218Z,
"host" => "node4"
}

在上一个示例的基础上,创建配置文件,文件名可以自定义。
vim /etc/logstash/conf.d/file-grok-stdout.conf

1
2
3
4
5
6
7
8
9
10
11
12
13
14
15
16
17
18
19
input {
file {
path => ["/var/log/httpd/access_log"]
start_position => "beginning"
}
}

filter {
grok {
match => { "message" => "%{HTTPD_COMBINEDLOG}" }
/* 指定将 message 字段以 HTTPD_COMBINEDLOG 的方式做模式匹配 */
}
}

output {
stdout {
codec => rubydebug
}
}

启动程序,可以看到输出的 httpd 日志已经被切割为多个字段;并且进行了模式匹配,将之前 message 的每段信息赋予了新的 key。让我们在做日志分析时,有章可循了。

1
2
3
4
5
6
7
8
9
10
11
12
13
14
15
16
17
18
19
~]# logstash -f /etc/logstash/conf.d/file-output.conf
{
"message" => "145.162.1.1 - - [30/Sep/2019:23:56:48 +0800] \"GET /test_page_5.html HTTP/1.1\" 200 12 \"-\" \"curl/7.29.0\"",
"clientip" => "145.162.1.1",
"auth" => "-",
"ident" => "-",
"timestamp" => "30/Sep/2019:23:56:48 +0800",
"verb" => "GET",
"request" => "/test_page_5.html",
"httpversion" => "1.1",
"response" => "200"
"bytes" => "12",
"referrer" => "\"-\"",
"agent" => "\"curl/7.29.0\"",
"host" => "node4",
"path" => "/var/log/httpd/access_log",
"@version" => "1",
"@timestamp" => 2019-09-30T15:57:16.592Z,
}

此时如果不想再保留 "message" 字段,可在 grok 模块内部使用 remove_field => "message""message" 字段过滤掉。这是一个通用的属性,每个插件应该都可以使用。

1
2
3
4
5
6
7
8
9
10
11
12
13
14
15
16
17
18
19
input {
file {
path => ["/var/log/httpd/access_log"]
start_position => "beginning"
}
}

filter {
grok {
match => { "message" => "%{HTTPD_COMBINEDLOG}" }
remove_field => "message" /* 添加此行,指定把 message 字段过滤掉 */
}
}

output {
stdout {
codec => rubydebug
}
}

Data filter plugin 数据替换插件

上面返回的信息中,有两个时间戳,其中:

  • "timestamp":是用户真正访问网站的时间戳;
  • "@timestamp":则是把日志读取出来时的时间戳。

在后面的日志分析时,"@timestamp" 字段的时间戳要作为时间序列使用,这样一来如果以读取日志的时间戳来作为分析标准就不合适了,应该使用用户真正访问的时间戳。

所以要用 "timestamp" 的时间戳,替换掉 "@timestamp" 中原来的时间。

Data filter plugin 插件就能够把默认带了 @ 符号的字段值,被另外一个字段中的值替换。

配置方式:创建配置文件,文件名可以自定义。
vim /etc/logstash/conf.d/file-date-stdout.conf

1
2
3
4
5
6
7
8
9
10
11
12
13
14
15
16
17
18
19
20
21
22
23
24
25
26
input {
file {
path => ["/var/log/httpd/access_log"]
start_position => "beginning"
}
}

filter {
grok {
match => { "message" => "%{HTTPD_COMBINEDLOG}" }
remove_field => "message"
}
date {
/* 从 timestamp 中按后面指定格式读取时间,替换掉带 @ 符号的同名字段 */
match => [ "timestamp","dd/MMM/YYYY:H:m:s Z" ]

/* 替换后原字段就不必再保留了,删除字段 */
remove_field => "timestamp"
}
}

output {
stdout {
codec => rubydebug
}
}

Geoip filter plugin 地理位置分析插件

Geoip 插件可以根据 IP 地址库分析地理位置。

地址库由 Maxmind 提供,是一个专门输出地理位置的软件,官方有两个版本:

  • GeoIP: 精细版,需要收费;
  • GeoLite: 简装版,免费使用;

GeoLite 下载地址:
https://dev.maxmind.com/geoip/geoip2/geolite2/

有两种格式可供下载,MaxMind DB 的二进制格式或 CSV 文本格式的,为了查询的速度更快,建议使用 DB 二进制格式的。

示例
把下载好的数据库传到主机上并解压,建议使用软链接,以后数据库更新时只更改软链接即可。

1
2
3
4
~]# mkdir /etc/logstash/maxmind/
~]# tar -zxvf GeoLite2-City_20191008.tar.gz -C /etc/logstash/maxmind
~]# ln -sv GeoLite2-City_20191008/GeoLite2-City.mmdb /etc/logstash/maxmind
‘/etc/logstash/maxmind/GeoLite2-City.mmdb’ -> ‘GeoLite2-City_20191008/GeoLite2-City.mmdb’

新建一个 geoip 插件的配置文件:
vim /etc/logstash/conf.d/file-geoip-stdout.conf

插件的配置参数:

  • source:指定从哪个字段来读取 IP 地址;
  • target:把IP地址做分析以后,转换成什么格式;
  • database:必须指定 MaxMind DB 的地址;
1
2
3
4
5
6
7
8
9
10
11
12
13
14
15
16
17
18
19
20
21
22
23
24
25
26
27
28
input {
file {
path => ["/var/log/httpd/access_log"]
start_position => "beginning"
}
}

filter {
grok {
match => { "message" => "%{HTTPD_COMBINEDLOG}" }
remove_field => "message"
}
date {
match => [ "timestamp","dd/MMM/YYYY:H:m:s Z" ]
remove_field => "timestamp"
}
geoip {
source => "clientip" /* 把这个字段中的值进行转换 */
target => "geoip" /* 转换后字段为 geoip */
database => "/etc/logstash/maxmind/GeoLite2-City.mmdb" /* 指明数据库文件路径 */
}
}

output {
stdout {
codec => rubydebug
}
}

指定刚才的配置文件并启动 logstash,就可以看到 "geoip" 字段中关于地理位置的信息了。

1
2
3
4
5
6
7
8
9
10
11
12
13
14
15
16
17
18
19
20
21
22
23
24
25
26
27
28
29
30
31
32
33
34
35
36
~]# logstash -f file-geoip-stdout.conf
{
"@timestamp" => 2019-10-12T07:39:55.015Z,
"clientip" => "212.220.1.1",
"auth" => "-",
"@version" => "1",
"request" => "/test_page_9.html",
"host" => "node4",
"agent" => "\"curl/7.29.0\"",
"response" => "200",
"httpversion" => "1.1",
"path" => "/var/log/httpd/access_log",
"verb" => "GET",
"timestamp" => "12/Oct/2019:15:39:54 +0800",
"ident" => "-",
"referrer" => "\"-\"",
"geoip" => {
"ip" => "212.220.1.1",
"region_name" => "Yamalo-Nenets",
"region_code" => "YAN",
"continent_code" => "EU",
"country_code3" => "RU",
"location" => {
"lon" => 76.6333,
"lat" => 66.0833
},
"timezone" => "Asia/Yekaterinburg",
"country_name" => "Russia",
"city_name" => "Novy Urengoy",
"latitude" => 66.0833,
"country_code2" => "RU",
"postal_code" => "629300",
"longitude" => 76.6333
},
"bytes" => "12"
}

另外如果觉得显示的字段太多了,可以在配置文件中使用 fields 参数,只显示需要保留的字段。

Mutate filter plugin 字段编辑插件

可以按需要操纵字段,例如重命名、删除、替换、修改字段等。

1
2
3
4
5
6
7
8
9
10
11
12
13
14
15
16
17
18
19
20
21
22
23
24
25
26
27
28
29
30
31
32
33
34
input {
file {
path => ["/var/log/httpd/access_log"]
start_position => "beginning"
}
}

filter {
grok {
match => { "message" => "%{HTTPD_COMBINEDLOG}"
}
remove_field => "message"
}
date {
match => [ "timestamp","dd/MMM/YYYY:H:m:s Z" ]
remove_field => "timestamp"
}
geoip {
source => "clientip"
target => "geoip"
database => "/etc/logstash/maxmind/GeoLite2-City.mmdb"
}
mutate {
rename => {
"agent" => "user_agent" /* 把 agent 字段重命名为 user_agent */
}
}
}

output {
stdout {
codec => rubydebug
}
}

更多参数参考官方文档。

Elasticsearch output plugin 输出插件

一开始介绍的输出插件是把处理后的信息输出到屏幕上,而 Elasticsearch output plugin 插件则可以把信息输出至 Elasticsearch 中。

主要参数:(所有参数都有默认值,可以都不指定)

  • hosts:指明 Elasticsearch 主机在哪里,使用 uri 格式;默认为 //127.0.0.1
  • index:指定索引名称;
  • document_type:指定放在索引的哪个类型上;注意type 将在 Elasticsearch 7.0.0 中的 API 中弃用,并在 8.0.0 中完全删除因此不建议使用;
  • document_id:文档的 ID 如何生成;
  • bulk_path:使用支持批量的插入;
  • http_compression:传输过程是否压缩;

示例:目标是将数据写入 Elasticsearch cluster 中。
编辑插件配置文件:vim /etc/logstash/conf.d/file-geoip-els.conf

1
2
3
4
5
6
7
8
9
10
11
12
13
14
15
16
17
18
19
20
21
22
23
24
25
26
27
28
29
30
31
32
input {
file {
path => ["/var/log/httpd/access_log"]
start_position => "beginning"
}
}

filter {
grok {
match => { "message" => "%{HTTPD_COMBINEDLOG}" }
remove_field => "message"
}
date {
match => [ "timestamp","dd/MMM/YYYY:H:m:s Z" ]
remove_field => "timestamp"
}
geoip {
source => "clientip"
target => "geoip"
database => "/etc/logstash/maxmind/GeoLite2-City.mmdb"
}
}

output {
elasticsearch {
hosts => ["http://node1:9200","http://node2:9200","http://node3:9200"]
index => "logstash-%{+YYYY.MM.dd}" /* 指定放在哪个索引中,也是默认值,以日期为单位生成新的索引 */
/* 如果在 Els 中看不到 index 名称有日期,可以换一个写法试试,
比如 logstash-httpd-access-%{+YYYY.MM.dd} */
document_type => "httpd_access_logs" /* 放在索引的哪个类型下,7.0 以上不要使用此参数,已经弃用 */
}
}

启动 Logstash。
logstash -f file-geoip-els.conf

查看索引,已经有 logstash 的索引了。

1
2
3
4
~]# curl http://node1:9200/_cat/indices
green open logstash hhUboSgRTZmz-AzylQzzig 1 1 74 0 374.7kb 272.1kb
# index 名字这里如果像这样只显示 “logstash”,没有日期
# 可以把 logstash 中的 index 配置换一个写法试试,比如 logstash-httpd-access-%{+YYYY.MM.dd}

在 Els 集群中以 clientip 字段为关键字进行搜索,就可以看到与此 ip 相关的所有数据了:

1
2
3
4
5
6
7
8
9
10
11
12
13
14
15
16
17
18
19
20
21
22
23
24
25
26
27
28
29
30
31
32
33
34
35
36
37
38
39
40
41
42
43
44
45
46
47
48
49
50
51
52
53
54
55
56
57
58
59
60
61
[root@node1 ~]# curl -s http://node1:9200/logstash/_search?q=clientip:90.87.1.1 | jq
{
"took": 2,
"timed_out": false,
"_shards": {
"total": 1,
"successful": 1,
"skipped": 0,
"failed": 0
},
"hits": {
"total": {
"value": 1,
"relation": "eq"
},
"max_score": 3.8286412,
"hits": [
{
"_index": "logstash",
"_type": "_doc",
"_id": "4tvzv20BrAdmwxGECt4H",
"_score": 3.8286412,
"_source": {
"response": "200",
"referrer": "\"-\"",
"@version": "1",
"clientip": "90.87.1.1",
"path": "/var/log/httpd/access_log",
"httpversion": "1.1",
"agent": "\"curl/7.29.0\"",
"auth": "-",
"request": "/test_page_18.html",
"bytes": "13",
"geoip": {
"country_code3": "FR",
"location": {
"lon": 2.3527,
"lat": 48.8543
},
"timezone": "Europe/Paris",
"country_name": "France",
"region_code": "75",
"continent_code": "EU",
"country_code2": "FR",
"region_name": "Paris",
"longitude": 2.3527,
"latitude": 48.8543,
"ip": "90.87.1.1",
"city_name": "Paris",
"postal_code": "75013"
},
"host": "node4",
"verb": "GET",
"@timestamp": "2019-10-12T12:30:38.000Z",
"ident": "-"
}
}
]
}
}

五、使用 Beats 完成日志收集工作

之前说过,Logstash 太重量级,光看程序的启动这么慢应该就很明显了,所以建议使用 Beats 套件中的 Filebeat 来代替 Logstash 完成获取数据的工作,而 Logstash 则负责收集 Filebeat 发来的数据,将其文档化后发给 Els 集群。

安装并配置 Beats

先上传 Filebeat 的 RPM 包,然后安装。

1
yum install ./filebeat-7.3.2-x86_64.rpm

编辑 Filebeat 配置文件:vim /etc/filebeat/filebeat.yml

===== Filebeat inputs =====:在这个配置段中主要配置从哪个文件中获取数据;

  • - type: log:定义文件来源的类型是日志;
  • enabled: false:更改为 true 以启用此输入配置;
  • paths::定义从哪里获取日志;可以有多个文件,书写格式为列表,比如:
1
2
3
paths:
- /var/log/httpd/access_log
- /var/log/httpd/error_log

===== Outputs ======:这个配置段中定义了把收集的数据输出到哪里;
默认配置是直接发往 Elasticsearch 的,但是 Filebeat 收集的数据没有文档化,不能直接发给 Elasticsearch。应该先交由 Logstash 的 Grok 模块把整个日志切割成多段后,再由 Logstash 统一发给 Elasticsearch。

所以这里要把关于 Elasticsearch 的配置注释掉!

1
2
# output.elasticsearch:
# hosts: ["localhost:9200"]

然后启用下面关于 Logstash 的配置!并指定把数据发给 Logstash。

1
2
output.logstash:
hosts: ["192.168.50.14:5044"]

而后启动 Filebeat 服务。

1
systemctl start filebeat

配置 Logstash

以下在 Logstash 中配置:

在 Logstash 中使用 Beats input plugin 插件从 Filebeat 获取数据。

以上文的配置文件为例,加入启用 Beats input plugin 插件的参数:

vim /etc/logstash/conf.d/beats-els.conf

1
2
3
4
5
6
7
8
9
10
11
12
13
14
15
16
17
18
19
20
21
22
23
24
25
26
27
28
29
input {
beats {
port => 5044 /* beats input 插件会自己监听在一个套接字上,默认为 5044 端口 */
}
}

filter {
grok {
match => { "message" => "%{HTTPD_COMBINEDLOG}" }
remove_field => "message"
}
date {
match => [ "timestamp","dd/MMM/YYYY:H:m:s Z" ]
remove_field => "timestamp"
}
geoip {
source => "clientip"
target => "geoip"
database => "/etc/logstash/maxmind/GeoLite2-City.mmdb"
}
}

output {
elasticsearch {
hosts => ["http://node1:9200","http://node2:9200","http://node3:9200"]
index => "logstash-%{+YYYY.MM.dd}"
document_type => "httpd_access_logs" /* 7.0 以上不要使用此参数,已经弃用 */
}
}

启动 Logstash。

1
logstash -f conf.d/beats-els.conf

这时,Logstash 中的 beats 插件就会监听在 5044 端口,接收来自 Beats 的数据;收到数据后,Logstash 就会将数据进行处理后,发往 Els 集群。

Logstash 输出的结果中包含 beats 字段信息,有的可能和其他信息重复了,比如主机名,IP 信息等。如果不想显示和 beats 相关的字段,就在 Logstash 配置文件的过滤器中再添加一个 Mutate 插件,删除指定字段即可:

1
2
3
mutate {
remove_field => ["agent"]
}

六、生产环境中使用 Redis 作为消息队列

如果 FIlebeat 节点很多,集群规模很大时,可是在 Filebeat 和 Logstash 中间添加一个 Redis 充当消息队列,来减轻 Logstash 服务器的压力。
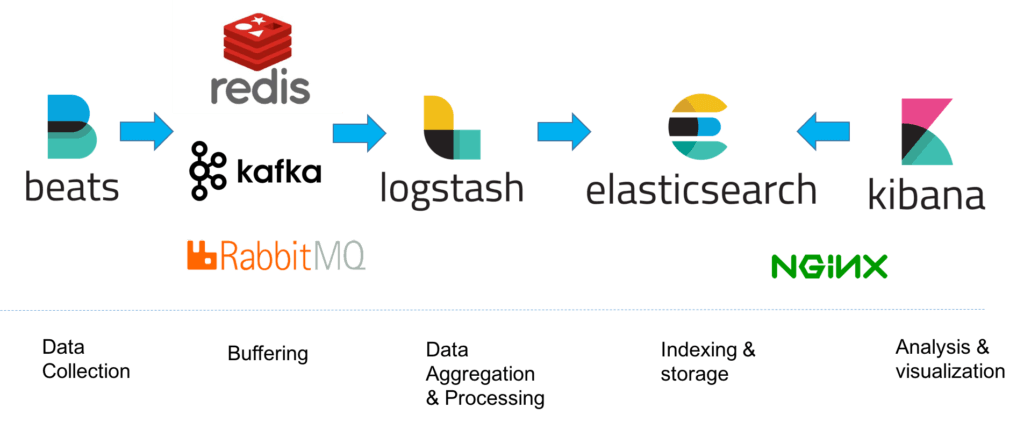
Redis_Logstash

注意:在生产环境中,要注意 Redis 和 Logstash 是否为单点。

建议

  • Redis 可以使用主备和集群,建议使用 Redis Cluster;
  • Logstash 可以部署多台,因为 Logstash 是无状态的,可以做成高可用。不过不建议使用 Keepalived,因为 Keepalived 比较适合为调度器做高可用,而这种重量级的服务,建议使用 corosync+pacemaker(在选修中)。

安装并配置 Redis

1
yum install redis

编辑 Redis 配置文件,配置如下必须的参数:

1
2
bind 0.0.0.0
requirepass monster # 为了安全,最好启用登录认证

启动 Redis 服务

1
systemctl start redis

配置 Filebeat

以下在 Filebeat 中配置

/etc/filebeat/filebeat.reference.yml 中有很多配置文件的示例可供参考。

其中在 ---- Redis output ---- 段中,就是输出到 Redis 时需要使用的配置示例。

编辑 Filebeat 的配置文件 /etc/filebeat/filebeat.yml,把和 Redis 相关的配置段复制进去,要注意配置段的所在位置。

1
2
3
4
5
6
7
8
9
10
11
12
13
14
#============ Outputs =================

...
...

#------------ Redis output ------------
output.redis:
enabled: true
hosts: ["localhost:6379"] # redis 服务器的地址
key: filebeat # 使用的 key 叫什么
password: monster
db: 0 # 使用 Redis 中第几号库
datatype: list # 数据类型是什么,默认是列表
worker: 1 # 启动几个 work 进程

重启 Filebeat。

1
systemctl restart filebeat

然后在 Redis 中应该就可以看到对应的 KEY 了。

1
2
3
4
5
6
7
~]# redis-cli -a monster
127.0.0.1:6379> KEYS *
1) "filebeat"

# 查看列表的第 0 号,有 Filebeat 发来的数据
127.0.0.1:6379> LINDEX filebeat 0
"{\"@timestamp\":\"2019-10-14T06:02:24.845Z\",\"@metadata\":{\"beat\":\"filebeat\",\"type\":\"_doc\",\"version\":\"7.3.2\"},\"agent\":{\"id\":\"bad26509-2d7d-486d-93e2-187dc5232bfc\",\"version\":\"7.3.2\",\"type\":\"filebeat\",\"ephemeral_id\":\"99787351-45ea-403b-9571-70b2b78141bf\",\"hostname\":\"node4.monster.com\"},\"ecs\":{\"version\":\"1.0.1\"},\"message\":\"53.68.1.1 - - [14/Oct/2019:14:02:24 +0800] \\\"GET /test_page_3.html HTTP/1.1\\\" 200 12 \\\"-\\\" \\\"curl/7.29.0\\\"\",\"log\":{\"offset\":2004615,\"file\":{\"path\":\"/var/log/httpd/access_log\"}},\"input\":{\"type\":\"log\"},\"host\":{\"os\":{\"codename\":\"Core\",\"platform\":\"centos\",\"version\":\"7 (Core)\",\"family\":\"redhat\",\"name\":\"CentOS Linux\",\"kernel\":\"3.10.0-957.el7.x86_64\"},\"name\":\"node4.monster.com\",\"id\":\"e8e8ed0beaa0447a8332f2def38ca625\",\"containerized\":false,\"hostname\":\"node4.monster.com\",\"architecture\":\"x86_64\"}}"

在 Logstash 中配置

以下在 Logstash 中配置

然后配置 Logstash,使其能够从 Redis 中获取数据。

使用 Redis input plugin 插件,可以从 Redis 中输入数据。

编辑配置文件:vim /etc/logstash/conf.d/redis-els.conf

1
2
3
4
5
6
7
8
9
10
11
12
13
14
15
16
17
18
19
20
21
22
23
24
25
26
27
28
29
30
31
32
33
34
35
36
input {
redis {
host => "192.168.50.14"
port => "6379"
password => "monster"
db => 0 /* 使用第几号库 */
key => "filebeat" /* key 是什么 */
threads => 5 /* 使用是个线程 */
data_type => "list" /* 数据类型 */
batch_count => 1 /* 一次读取几个 */
}
}

filter {
grok {
match => { "message" => "%{HTTPD_COMBINEDLOG}" }
remove_field => "message"
}
date {
match => [ "timestamp","dd/MMM/YYYY:H:m:s Z" ]
remove_field => "timestamp"
}
geoip {
source => "clientip"
target => "geoip"
database => "/etc/logstash/maxmind/GeoLite2-City.mmdb"
}
}

output {
elasticsearch {
hosts => ["http://node1:9200","http://node2:9200","http://node3:9200"]
index => "logstash-%{+YYYY.MM.dd}"
document_type => "httpd_access_logs" /* 7.0 以上不要使用此参数,已经弃用 */
}
}

此时可以先去 Redis 中查看已经保存了多少行的数据,这里显示有 8203 行。

1
2
3
~]# redis-cli -a monster
127.0.0.1:6379> LLEN filebeat
(integer) 8203

接下来启动 Logstash 服务,就会发现 Redis 中的数据在慢慢减少,直到被 Logstash 完全拿走,变成空的。

1
2
3
4
5
6
7
8
9
10
11
12
13
~]# redis-cli -a monster
127.0.0.1:6379> LLEN filebeat
(integer) 765
127.0.0.1:6379> LLEN filebeat
(integer) 640
127.0.0.1:6379> LLEN filebeat
(integer) 523
127.0.0.1:6379> LLEN filebeat
(integer) 0
127.0.0.1:6379> LLEN filebeat
(integer) 0
127.0.0.1:6379> LLEN filebeat
(integer) 0

七、事件判断

事件判断是什么?

如果期望能从多种数据源中获取不同的日志,并分别进行不同的过滤的话,就需要使用事件判断。

事件判断可以在同一组配置文件,或者不同的配置文件中,来分别指定使用不同的输入插件,同时分别使用不同的输出插件和过滤器插件。

比如 Apache 或 Tomcat,他们都分别有 Access 日志和运行日志。当使用 Geoip 和 Gork 这样的插件处理数据时,其实只对 Access 日志生效就可以了,运行日志不需要这样的操作,所以这时就需要对不同的数据源,使用不同的过滤和输出插件。

即便是从 Redis 中获取数据,Redis 中也应该针对不同的数据类型使用了不同的 Key 来保存。这样在对数据进行不同的处理后,输出到 Elasticsearch 时也可以针对不同的数据使其保存到不同的索引当中去。

官方说明

语法

可以使用单分支、双分支或多分支的 if 语句:

1
2
3
4
5
6
7
if EXPRESSION {
...
} else if EXPRESSION {
...
} else {
...
}

可以使用的比较运算符:

  • 平等:==, !=, <, >, <=, >=
  • regexp 模式匹配:=~, !~;
  • 包含:in, not in

也可以使用的布尔型运算符:

  • and, or, nand, xor
  • !

如果需要匹配 json 格式中的字段,比如想匹配下面示例中的 lon 字段。

1
2
3
4
5
6
7
8
9
10
11
"geoip": {
"country_code2": "RU",
"ip": "195.133.1.1",
"timezone": "Europe/Moscow",
"latitude": 55.7386,
"country_code3": "RU",
"country_name": "Russia",
"location": {
"lon": 37.6068,
"lat": 55.7386
}

要写为多级的字段的格式:

1
if [geoip][location][lon] == "37.6068"

示例:对 httpd 日志做类型的判断

在 Filebeat 获取数据时,可以使用 fields 参数为数据添加一个自定义字段,用于在 Logstash 中做判断使用。
官方相关文档

以下在 Filebeat 中配置

在 Filebeat 配置文件 /etc/filebeat/filebeat.yml 中定义:

1
2
3
4
5
6
7
8
9
10
11
12
13
14
15
filebeat.inputs:
- type: log
paths:
- "/var/log/httpd/access_log" /* 这里定义 access 日志 */
fields:
apache_log: access /* 添加一个自定义字段用于标记,之后给 Logstash 做判断使用 */
fields_under_root: false /* 如果此参数设置为 true,则自定义字段将作为顶级字段存储在输出文档中,
而不是分组在 fields 子词典下。
如果自定义字段名称与 Filebeat 添加的其他字段名称冲突,
则自定义字段将覆盖其他字段。 */
- type: log
paths:
- "/var/log/httpd/error_log" /* 这里定义 error 日志 */
fields:
apache_log: error /* 添加一个自定义字段用于标记,之后给 Logstash 做判断使用 */

以下在 Logstash 中配置

在 Logstash 配置文件 vim /etc/logstash/conf.d/redis-condition-els.conf 中定义判断依据和逻辑:

1
2
3
4
5
6
7
8
9
10
11
12
13
14
15
16
17
18
19
20
21
22
23
24
25
26
27
28
29
30
31
32
33
34
35
36
37
38
39
40
41
42
43
44
45
input {
redis {
host => "192.168.50.14"
port => "6379"
password => "monster"
db => 0
key => "filebeat"
threads => 5
data_type => "list"
batch_count => 1
}
}

filter {
if [fields][apache_log] == "access" { /* 如果 apache_log 字段的值为 access,则进行下面的处理,
否则不进行处理直接输出 */
grok {
match => { "message" => "%{HTTPD_COMBINEDLOG}" }
remove_field => "message"
}
date {
match => [ "timestamp","dd/MMM/YYYY:H:m:s Z" ]
remove_field => "timestamp"
}
geoip {
source => "clientip"
target => "geoip"
database => "/etc/logstash/maxmind/GeoLite2-City.mmdb"
}
}
}

output {
if [fields][apache_log] == "access" { /* 如果 apache_log 字段为 access,就把数据发给 Els 中的 logstash-access... 索引 */
elasticsearch {
hosts => ["http://node1:9200","http://node2:9200","http://node3:9200"]
index => "logstash-access-%{+YYYY.MM.dd}"
}
} else {
elasticsearch { /* 否则就发给 logstash-error 索引 */
hosts => ["http://node1:9200","http://node2:9200","http://node3:9200"]
index => "logstash-error-%{+YYYY.MM.dd}"
}
}
}

如果只有这一个配置文件,这可以直接以守护进程启动 Logstash。

1
systemctl start logstash

八、Kibana

kibana

介绍

Kibana 是一个基于 H5 开发的程序,提供了一个内键的 Web 服务器,可以直观的展示 Els 集群中的数据。

默认监听在 5601 的端口。

Kibana 是无状态的,数据都存储在 Els 集群中,所以可以部署多个,使用 Nginx 或者 Keepalived 部署为高可用。

安装和配置

把 RPM 安装包上传到服务器 Kibana。

1
yum install ./kibana-7.3.2-x86_64.rpm

编辑配置文件:/etc/kibana/kibana.yml

  • server.port: 5601:默认监听端口;
  • server.host: "0.0.0.0":定义对外监听的地址;
  • #server.basePath: "":可以定义子 url;
  • server.name: "node1.monster.com":主机名;
  • elasticsearch.url: "http://node1.monster.com":指定 Els 集群的地址,如果 Els 没做 HA 可随便指定一个;
  • elasticsearch.preserveHost: true:使用 Els 访问时是否保留原来的主机头;
  • kibana.index: ".kibana":kibana 自己也有索引信息,保存在 Els 中时使用的索引名;
  • i18n.locale: "zh-CN":启用中文界面。

启动服务之后,就可以从浏览器访问 Kibana 了,默认没有用户名和密码。

1
systemctl status kibana

告诉 Kibana 从何处获取数据源

kibana_1

kibana_1

kibana_1

搜索数据

现在就可以在 Kibana 中搜索了,比如要搜索日志中响应码是 404 的数据,按如下操作进行。
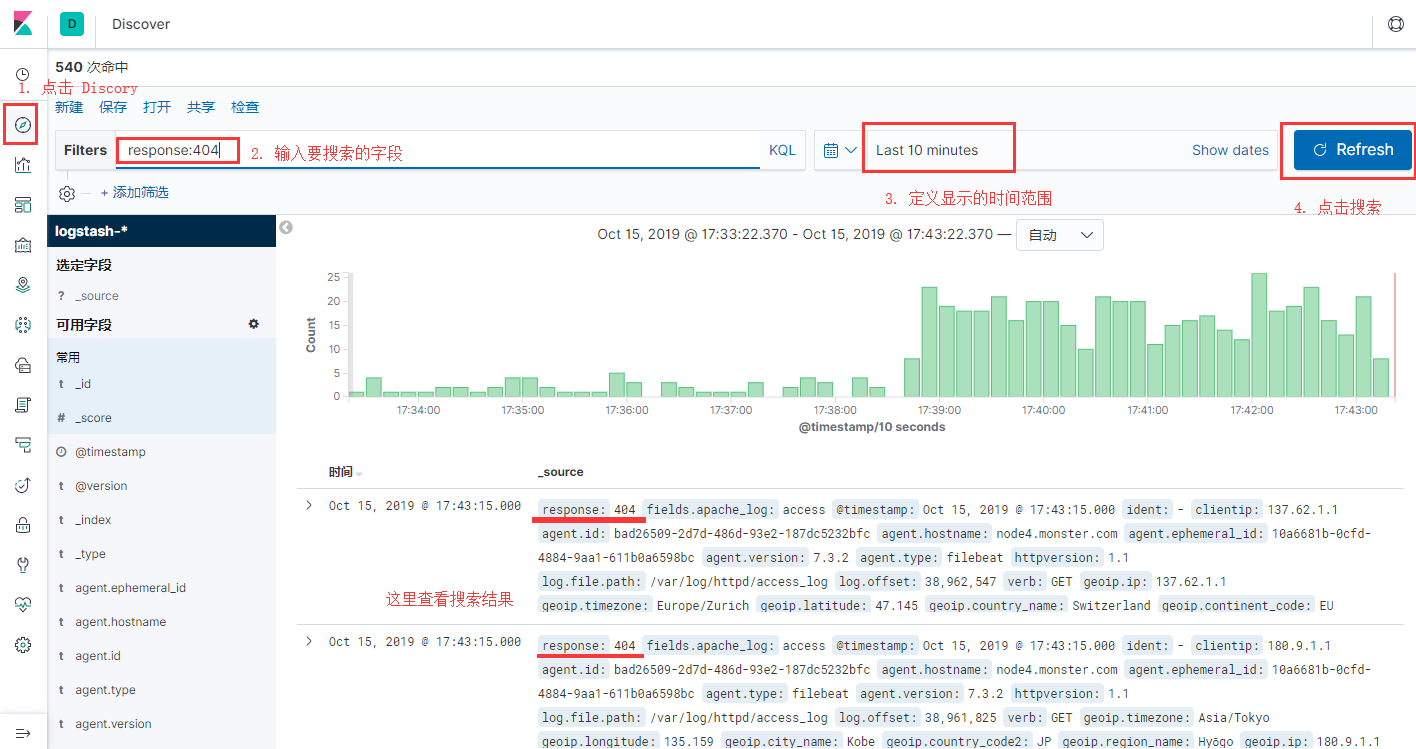
kibana_1